- EU projects
- Research
- Fish tagging
- Lumpfish research
- Oceanography
- Seabed mapping
- Arnarfjörður
- Drekasvæði
- Ísafjarðardjúp
- Jökulbanki
- Jökuldjúp
- Kolbeinseyjarhryggur and adjacent area
- Kolluáll
- Langanesgrunn
- Látragrunn
- Nesdjúp
- Reykjaneshryggur and adjacent area
- Selvogsbanki
- South of Selvogsbanki
- South of Skeiðarárdjúp
- South of Skerjadjúp
- Southeast of Lónsdjúp
- Southwest of Jökuldjúp
- Suðausturmið
- Suðurdjúp
- Vesturdjúp
- East of Reykjaneshryggur
- Vestfjardarmid
- Seal research
- Whale Research
- Advice
- About

Record ocean temperatures and salinity
06. March 2026
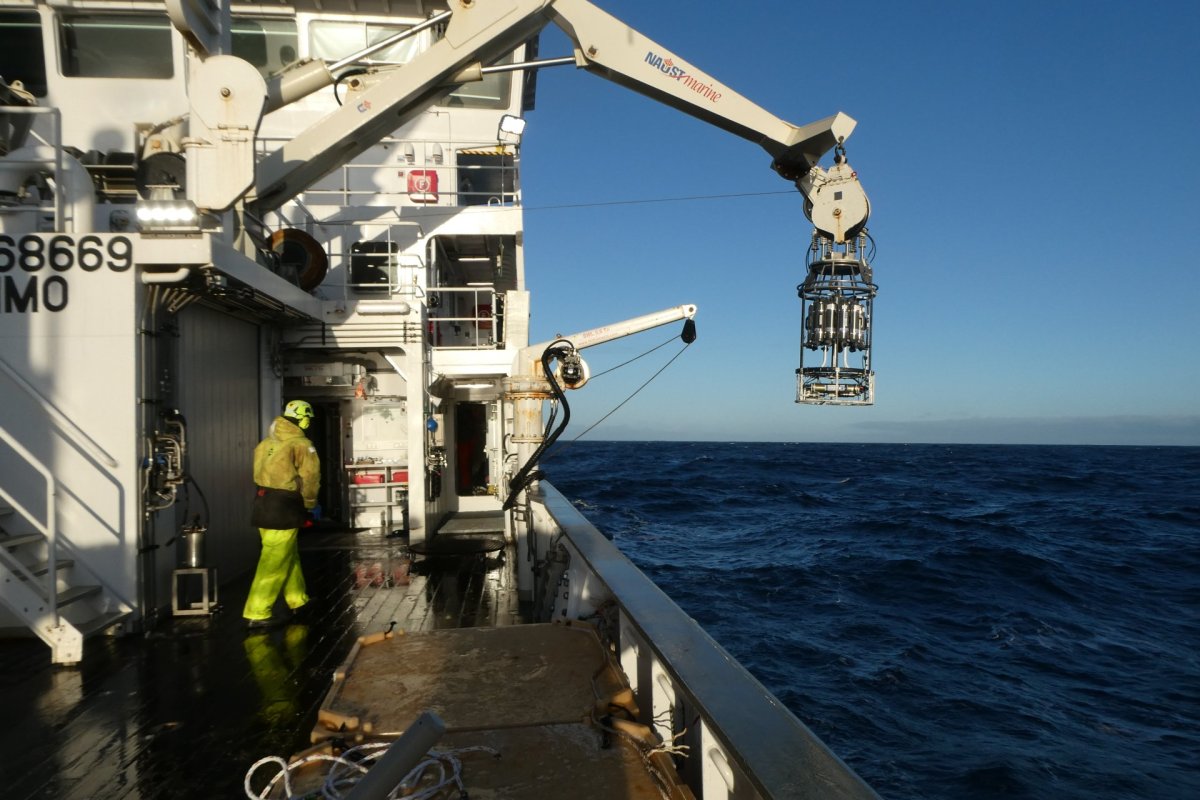 Deployment of the CTD from RV Þórunn Þórðardóttir, for measuring temperature and salinity profiles and taking water samples (fig. 1).
The annual winter research survey ended on 17 February after 15 days at sea onboard RV Þórunn Þórðardóttir. The primary objective of the survey is to monitor the environmental conditions in the ocean around Iceland in winter, and it is part of the regular hydrographic surveys “ástand sjávar” (e. condition of the ocean) conducted three to four times per year by the MFRI since 1970. Such sustained long-term observations are critical for understanding seasonal, interannual and climate-change related variability of ocean environment and ecosystems.
Ten standard transects distributed around Iceland were visited and vertical profiles of salinity and temperature measured on one hundred stations. Seawater samples were collected throughout the water column for analysis of various biogeochemical parameters, nutrients, inorganic carbon (ocean acidification) and oxygen. Additionally, current direction and velocity down to 1000 m and surface observations of temperature, salinity, and CO2 were collected continuously along the ship’s track.
This year, measurements were also taken in several fjords and coastal areas as part of monitoring the environmental impacts of marine sea-pen aquaculture and to gather new data for assessing the condition of coastal water bodies in relation to implementation of the water framework directive that is part of the ongoing LIFE Icewater project.
Key results
Temperature in the upper 200 m was generally above the long-term average. At many stations, temperatures were higher than ever measured before since the start of regular winter monitoring in 1970. The Atlantic Water (AW) south and west of Iceland showed record temperatures, reaching 8.55 °C at station Selvogsbanki 5 (SB5) (Figs. 2-4). Salinity as well as temperature reached almost record values at Stokksnes 4 (ST4), with 35.28 and 8.8 °C, respectively (Fig. 2). North of Iceland, where variable amounts of AW are mixing with polar and arctic waters, temperature at the Siglunes section (SI4) reached record value of 5.0 °C, with a subsurface core of AW extending as far as to Langanes (LA3) (Fig. 2).
At the same time, low temperatures and record-breaking low salinity were observed on the outermost stations (LB8 and KG6) in Denmark Strait that are within the polar waters of the East Greenland Current (Figs. 2 and 3).
This year’s winter survey thus documented extreme values in both the warm and saline Atlantic Water from the south, and the cold and fresh polar waters from the north affected by ice melt that interact in the ocean around Iceland. Despite large interannual variability, a general warming trend has been observed since 1970. The warming south of Iceland is consistent with the Atlantic Water recovering from a large scale cold and fresh anomaly south of Iceland since 2017. Already in May 2025, a record-breaking marine heat wave was observed around Iceland. The deep-reaching temperature and salinity anomalies in the Atlantic Water observed now suggest increased large-scale northward oceanic heat transport, which may in turn affect weather in Iceland and elsewhere. Indeed, air temperatures in Iceland in 2025 were the warmest ever recorded.
Further research is needed
It is uncertain about how such heat waves affect deep‑water formation and whether this increased northward heat transport will continue in the coming years or decrease again. Changes in heat transport could indicate a strengthening (increased heat flow) or weakening (cooling) of the Atlantic overturning circulation (the Atlantic Meridional Overturning Circulation, AMOC), but further research is needed on the relationship between the AMOC and the measurements presented here, and it is difficult to assess the state of the AMOC based on observations over a short time span.
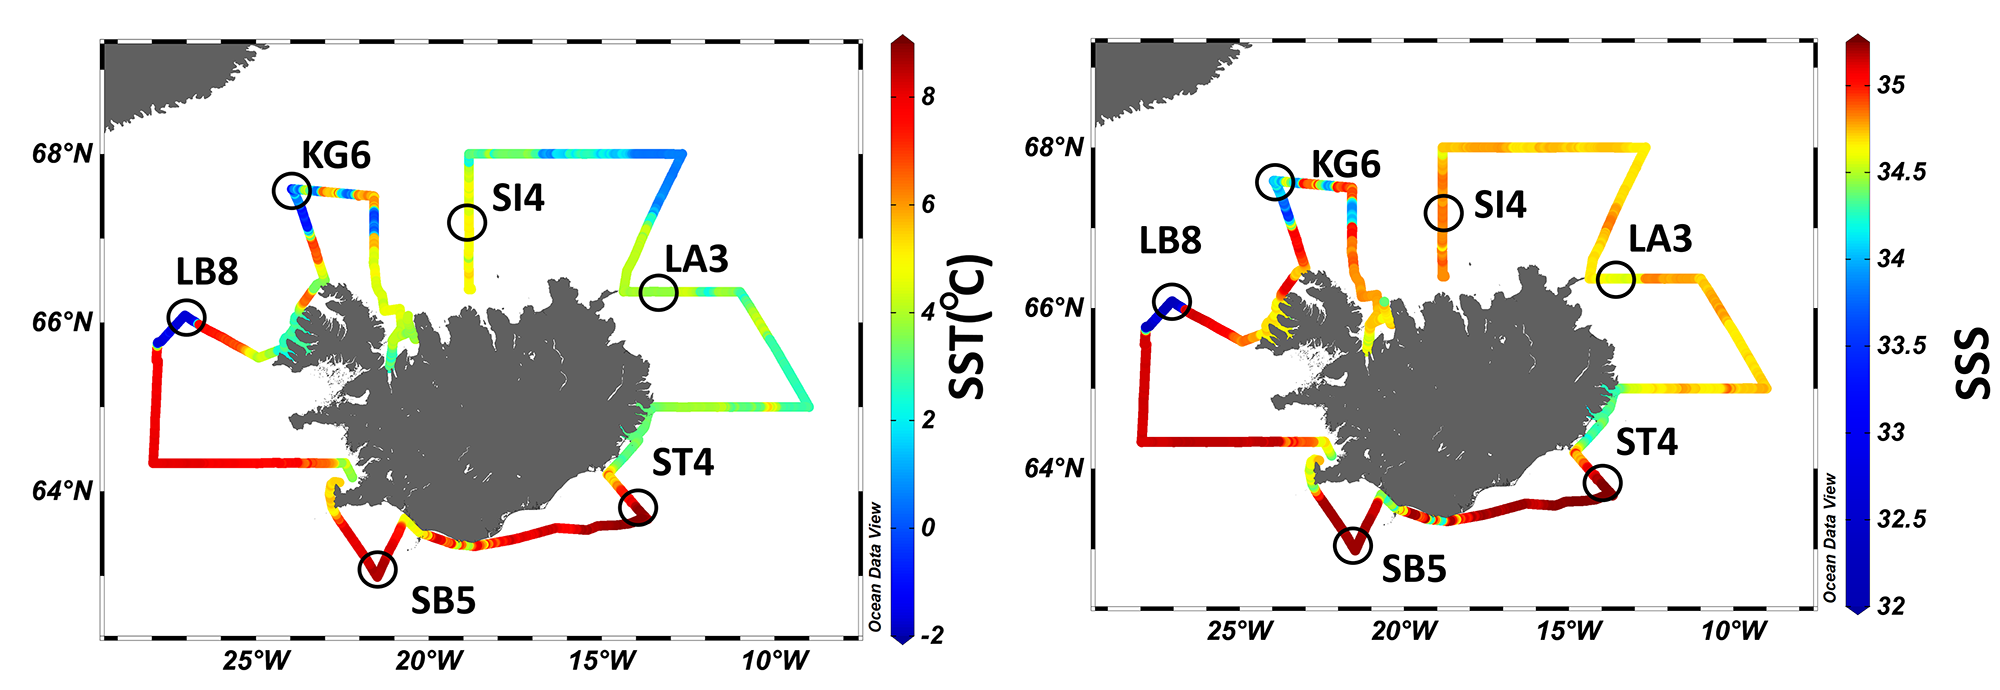
Fig. 2: Sea surface temperature and salinity along the survey track in February 2026. Circles indicate selected stations shown in Figs. 3 and 4.
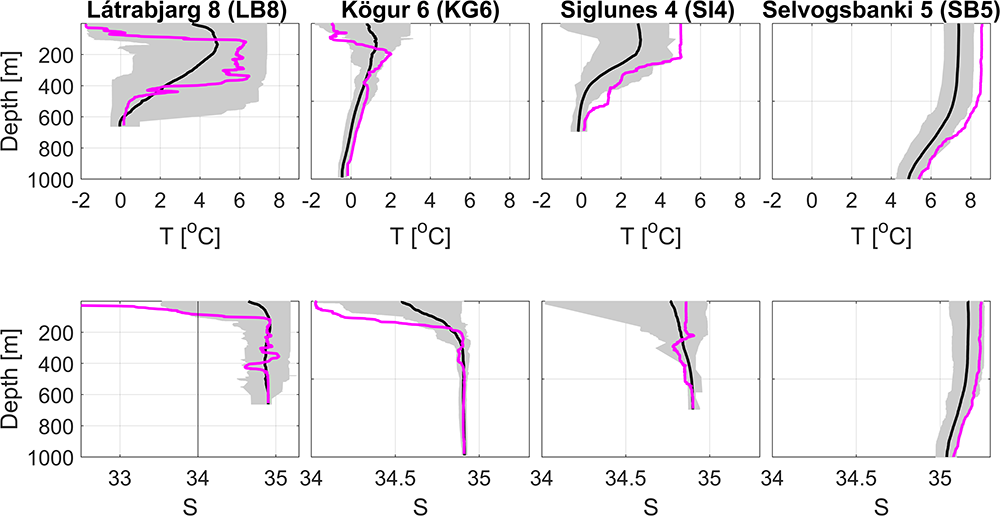
Fig. 3: Temperature (upper panel) and salinity (lower panel) profiles at four different stations collected during the February 2026 cruise (magenta), compared with the long-term winter mean profiles (black). Grey shading indicates the historical range of observed winter values 1970 – 2025. Note that the temperature at Siglunes 4 and Selvogsbanki 5 is higher than ever before, while at Látrabjarg 8 and Kögur 6, near-surface water is extremely cold and fresh. Note the different salinity scale at LB8.
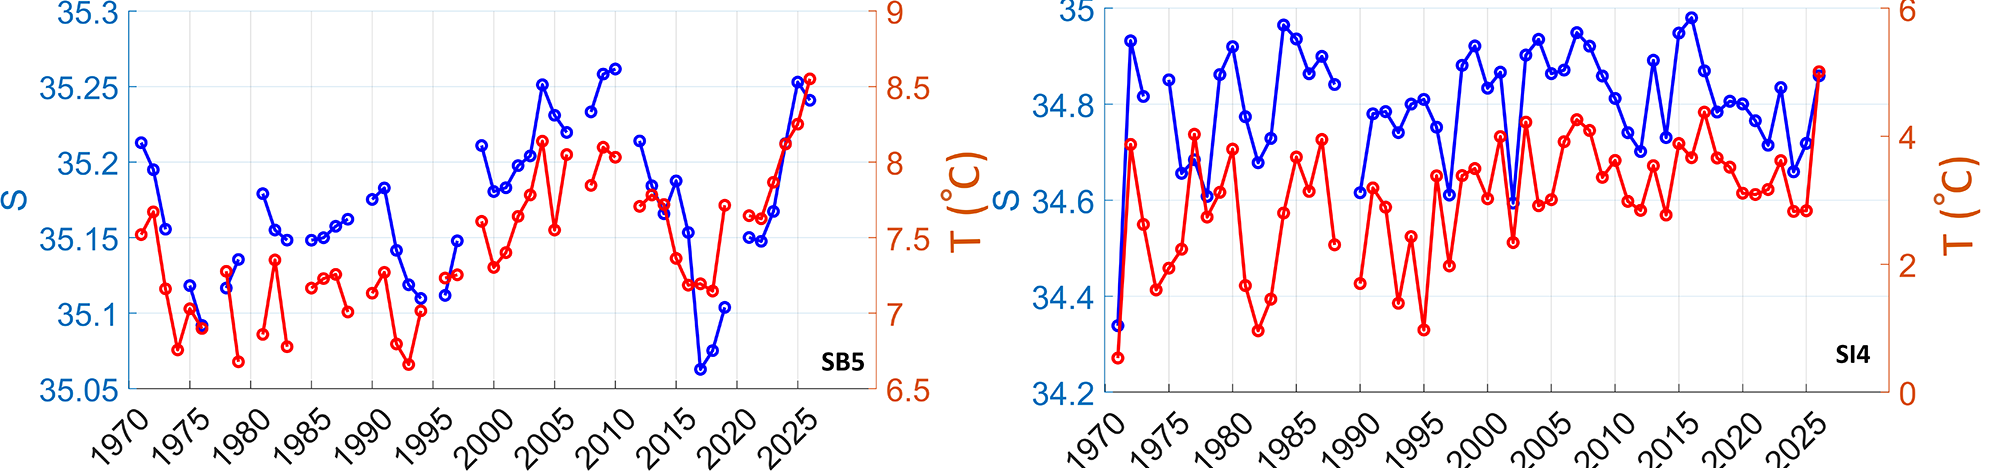
Fig. 4: Temperature (red) and salinity (blue) at Selvogsbanki 5 and at Siglunes 4 from winter surveys 1970 – 2026 (0 – 200 m depth averages), showing the record heat in February 2026.